JVM Java Memory Profiling (VisualVM, JConsole, JProfile)
There are times when iDempiere is not behaving as expected or desired. You can use common java tools to look into iDempiere and see how or what is going on inside the application. Below are introductions to some common tools for profiling Java (JProfile, VisualVM and JConsole).
Also see general monitoring page (includes example usage of jcmd - java command line tool).
JProfiler - Paid and Very Much Worth It
It is quite ridiculous how easy it is to use JProfiler. The only downside is that it is not free. You can use it to monitor iDempiere while you are in your IDE, and you can use it to monitor iDempiere when deployed.
Here is an overview of my scenario and how I installed/used JProfiler for remote monitoring:
- On your windows, mac or linux machine, download and install jprofiler from the jprofiler download page. On my linux server, I downloaded the Setup Executable (.sh) from the jprofiler download page. This script is an installer. Once the installation completes, you will have an icon on your desktop.
- On your iDempiere server, download the *.tar.gz version from the same download page using the following example commands:
- cd
- wget https://download-keycdn.ej-technologies.com/jprofiler/jprofiler_linux_10_1_5.tar.gz
- tar xvzf jprofiler_linux_10_1_5.tar.gz
- There is no need to install anything. Instead, simply navigate to the jpenable script and execute it. Example:
- cd ~/jprofiler10.1.5/bin/
- sudo -u idempiere ./jpenable
- NOTE: it is not possible to unload a JVMTI profiling agent. The JVM only unloads agents when it shuts down.
- Note that I ran this script as the idempiere user. This is because iDempiere is running as that user.
- It will find iDempiere running, and it will ask you the profiling mode. Choose GUI mode.
- The script will give you a port for monitoring and exit.
- Go back on your windows, mac or linux machine and launch jprofiler.
- In the jprofiler start center dialog choose "quick attach" => "on another computer"
- Click on the ssh tunnel => edit button to configure you connections details along with the previously mentioned monitoring port. Yes, it even creates an ssh tunnel for you!!
- Connect. That's it!!
You will have access to more information that you know what to do with.
Here is a tutorial to connect to a remote server without even running jpenable on the server side.
https://www.youtube.com/watch?v=tYieP2s34YI
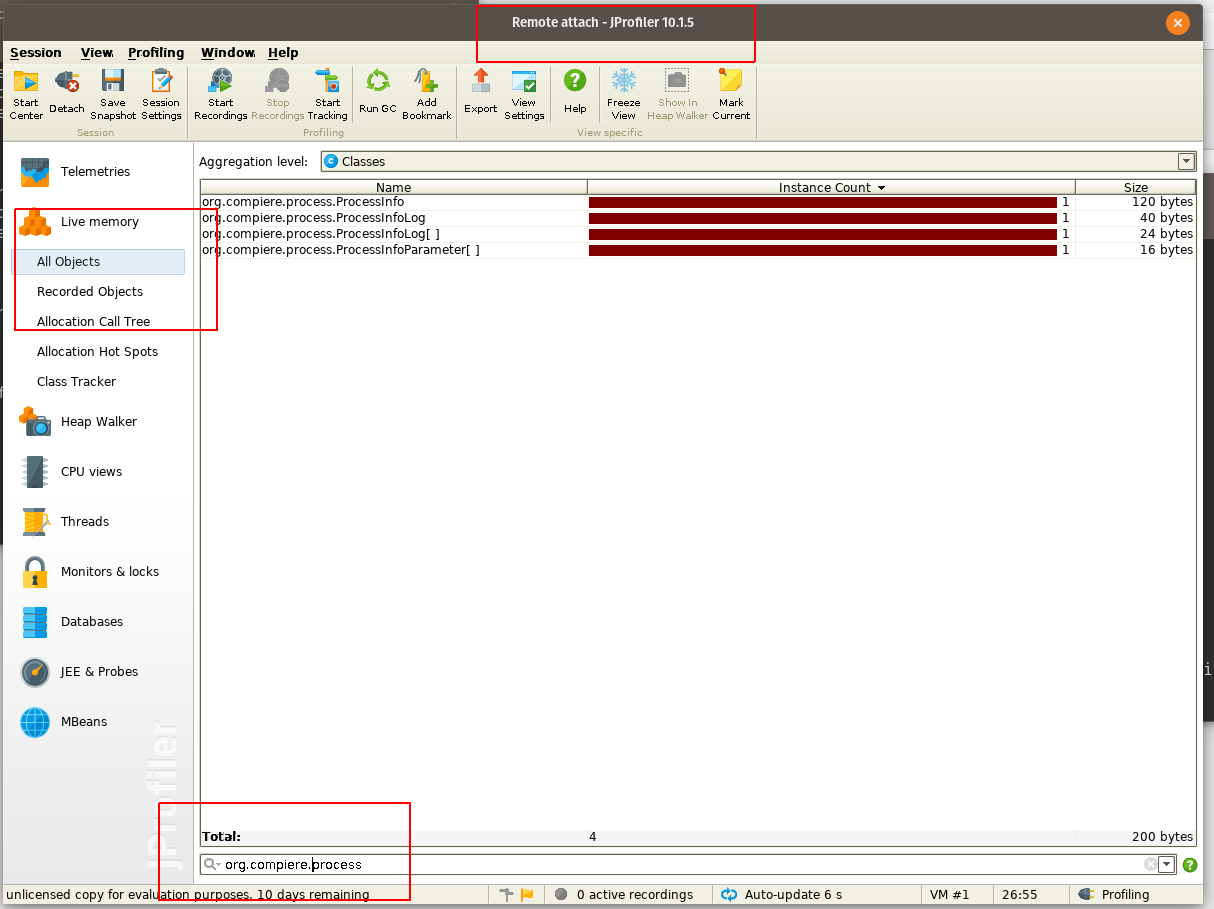
Using JProfiler to View Active Classes
Mapping Java Threads to Linux OS Processes
Helpful link
IBM Heap Analyzer
Introduction to IBM Heap Analyzer
JDK Out of the Box Tools
https://www.youtube.com/watch?v=Pqf367x-OuA
23:00 jcmd - command line tool to interact with JVM
VisualVM and JConsole
I have tried on several occasions to use each of these fee tools. Either I do not have enough knowledge, patience or skill, but regardless, I have yet to achieve success. If you can experience in this area, and you would like to share with the group, please let me know.
Note: once I touch on this level of detail, I typically enlist the help of a core developer to help guide me through the discovery process. I hope this helps you get started!
Good tutorial series for VisualVM
JConsole introduction